Full project insight at your fingertips: comprehensive static analysis, cross-references, industry-standard compliance and AI-powered summaries in one tool.


AI-powered code understanding built on the deep cross-reference analysis of SciTools Understand. Onboard helps developers quickly understand unfamiliar codebases, making it faster and easier to onboard new engineers and navigate complex systems.
 Try it Out
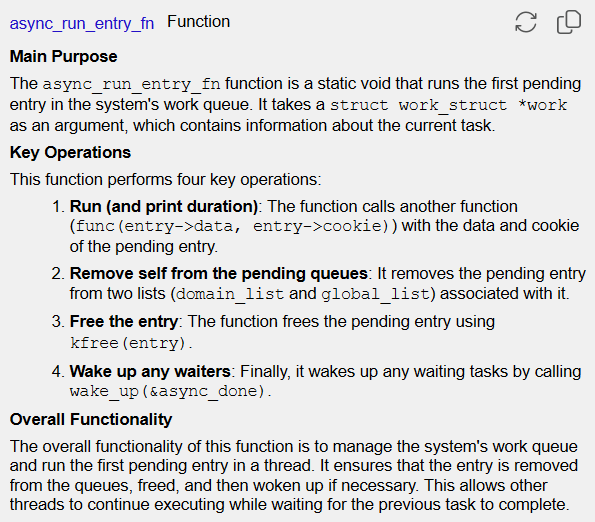
Our new AI tool provides detailed analysis and explanations of your code, highlighting potential issues and suggesting improvements. Quickly onboard new members with Understand AI.
 Learn More
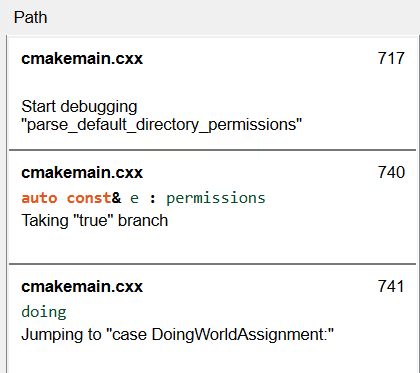
Our virtual debugger lets you step through code, offering a clear view of execution stages. It's essential for trying out different scenarios and edge cases.
 Learn More
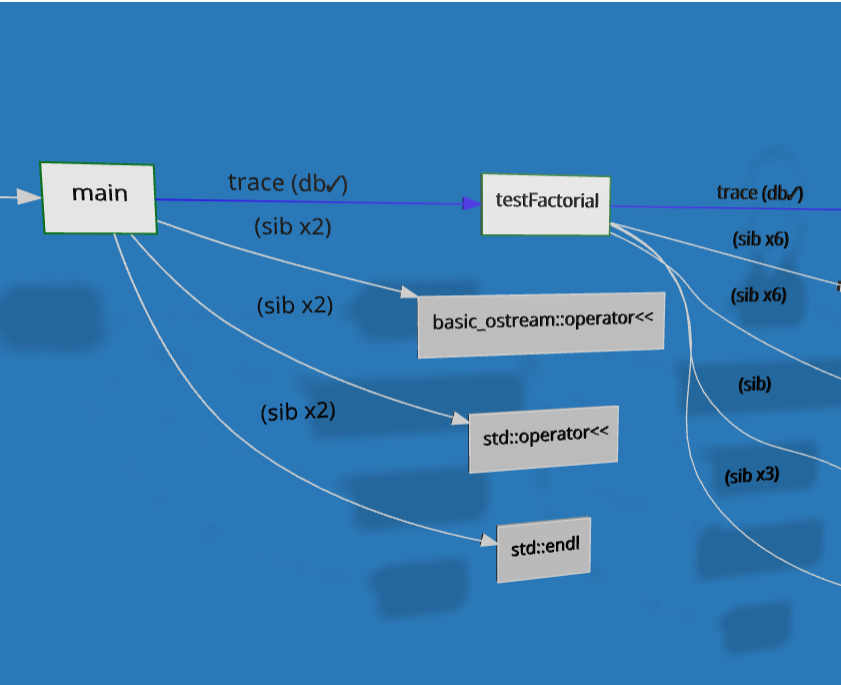
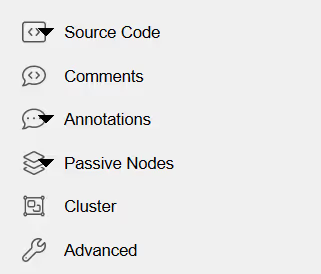
New customization options enable you to personalize your graphs. Click graph nodes to get a preview and AI summary of the code, or drag to move and shape the graph.
 Learn More


Dangling Pointer
Division by Zero
Memory Leak
Null Pointer Dereference
Stack Address Escape
Undefined Call
Unintialized Value
Virtual Call
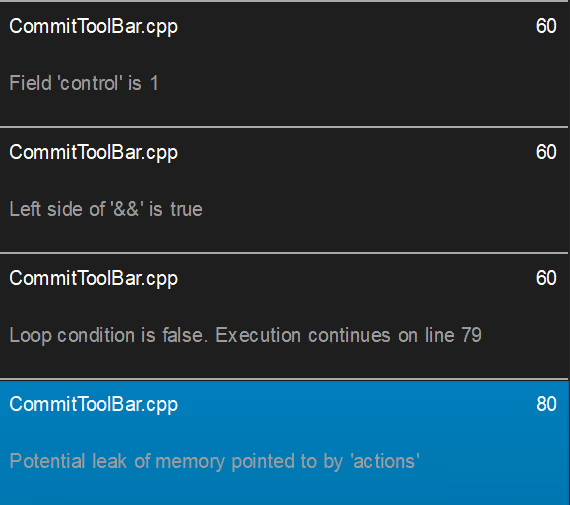
Bug Hunter will show you step by step how the bug can be recreated.
Bug Hunter will run in the background while you work and can be setup as part of your CI/CD pipeline so every commit can be bug free.
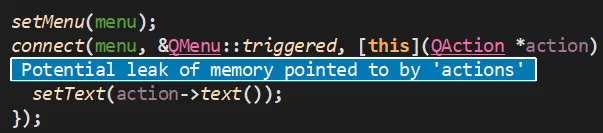
See the bug highlighted directly in your code, with a detailed explanation for each part.
Our new AI tool provides detailed analysis and explanations of your code, highlighting potential issues and suggesting improvements. It simplifies complex code structures, making it easier for you to grasp the logic and flow of your programs.
Learn More
Our virtual debugger lets you step through code, offering a clear view of execution stages. It's essential for trying out different scenarios and edge cases.
Learn More
New customization options enable you to personalize your graphs. Click graph nodes to get a preview and AI summary of the code, or drag to move and shape the graph.
Learn More
Ensure every commit is safe. Bug Hunter will notify and walk you through each step to fix the bug.
Dangling Pointer
Division by Zero
Memory Leak
Null Pointer Dereference
Stack Address Escape
Undefined Call
Unintialized Value
Virtual Call
Bug Hunter will run in the background while you work and can be setup as part of your CI/CD pipeline so every commit can be bug free.
See the bug highlighted directly in your code, with a detailed explanation for each part.
Bug Hunter will show you step by step how the bug can be recreated.
Understand assists you with every code writing task, whether you are an industry veteran or just getting started on a new team

Does your project require strict coding standards? Check your code against common, standards.
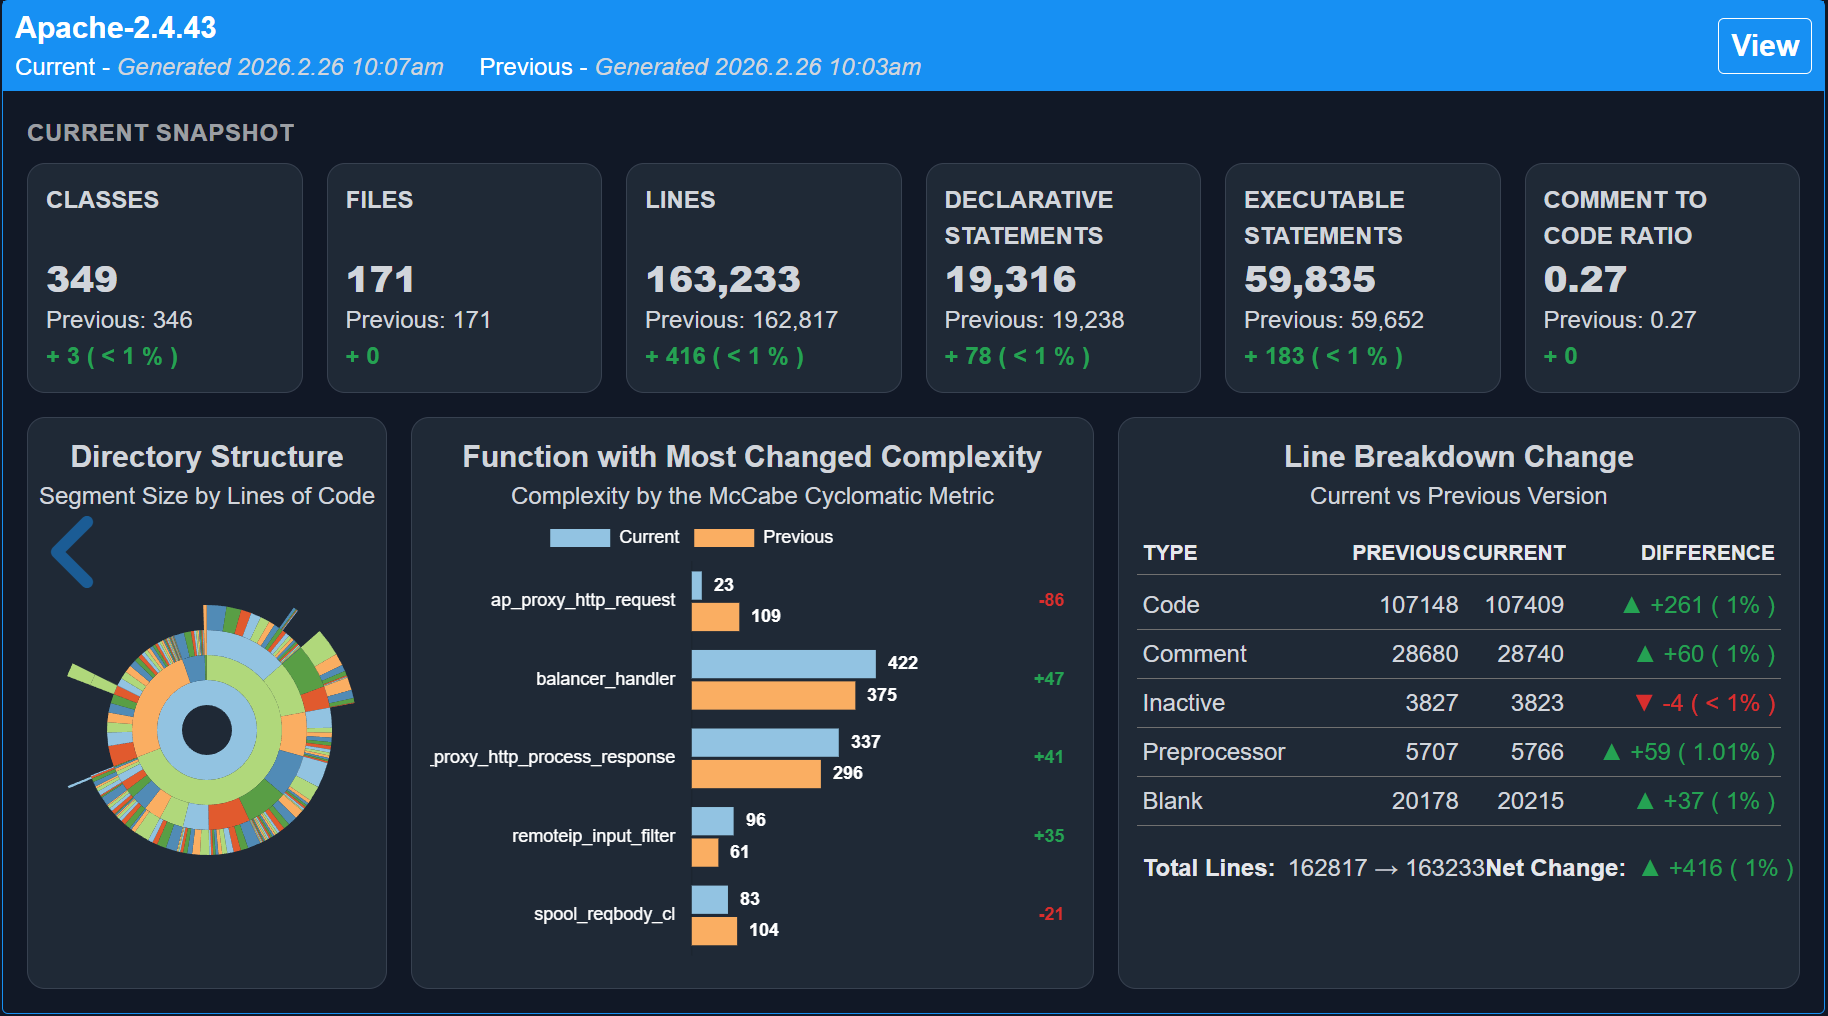
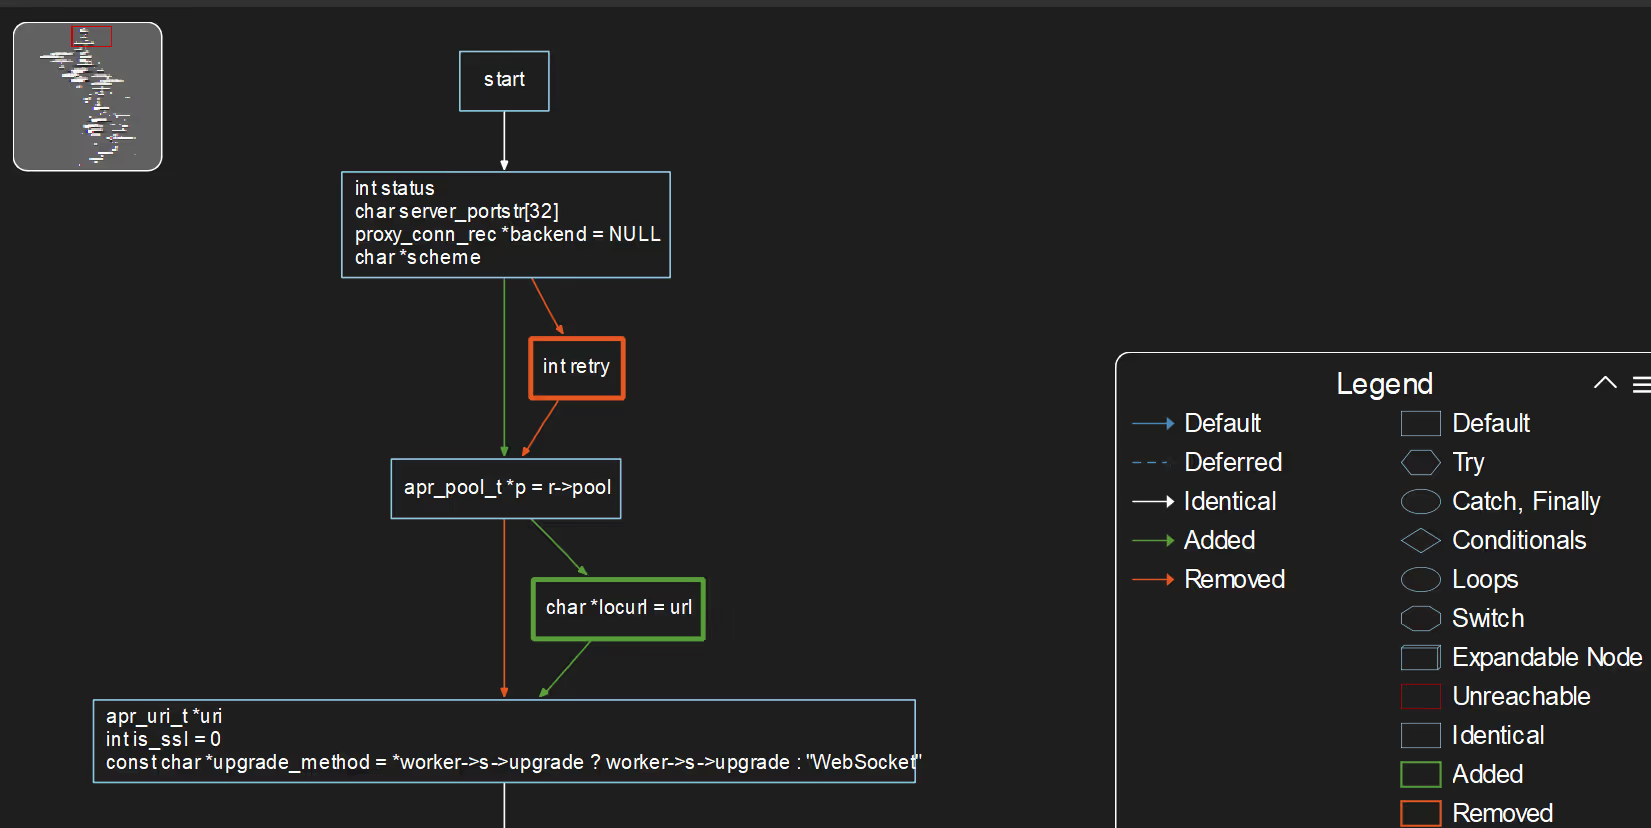
Quickly see the difference between two project states. View changes by files, folders, entities or architectures.

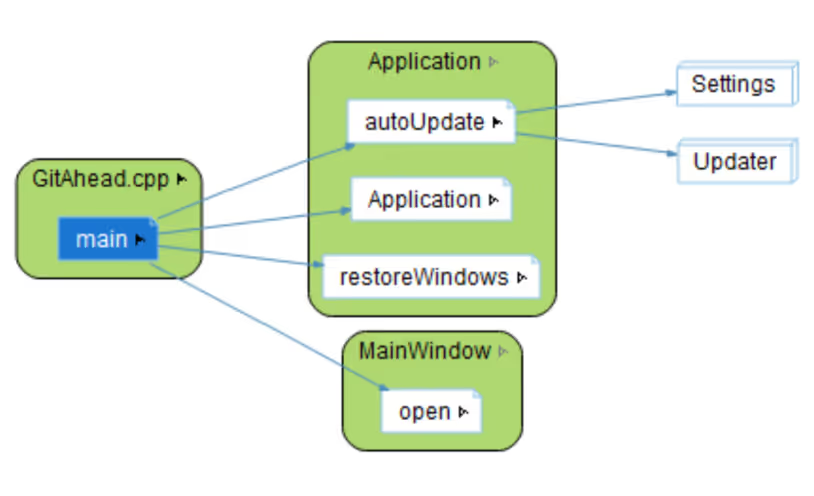
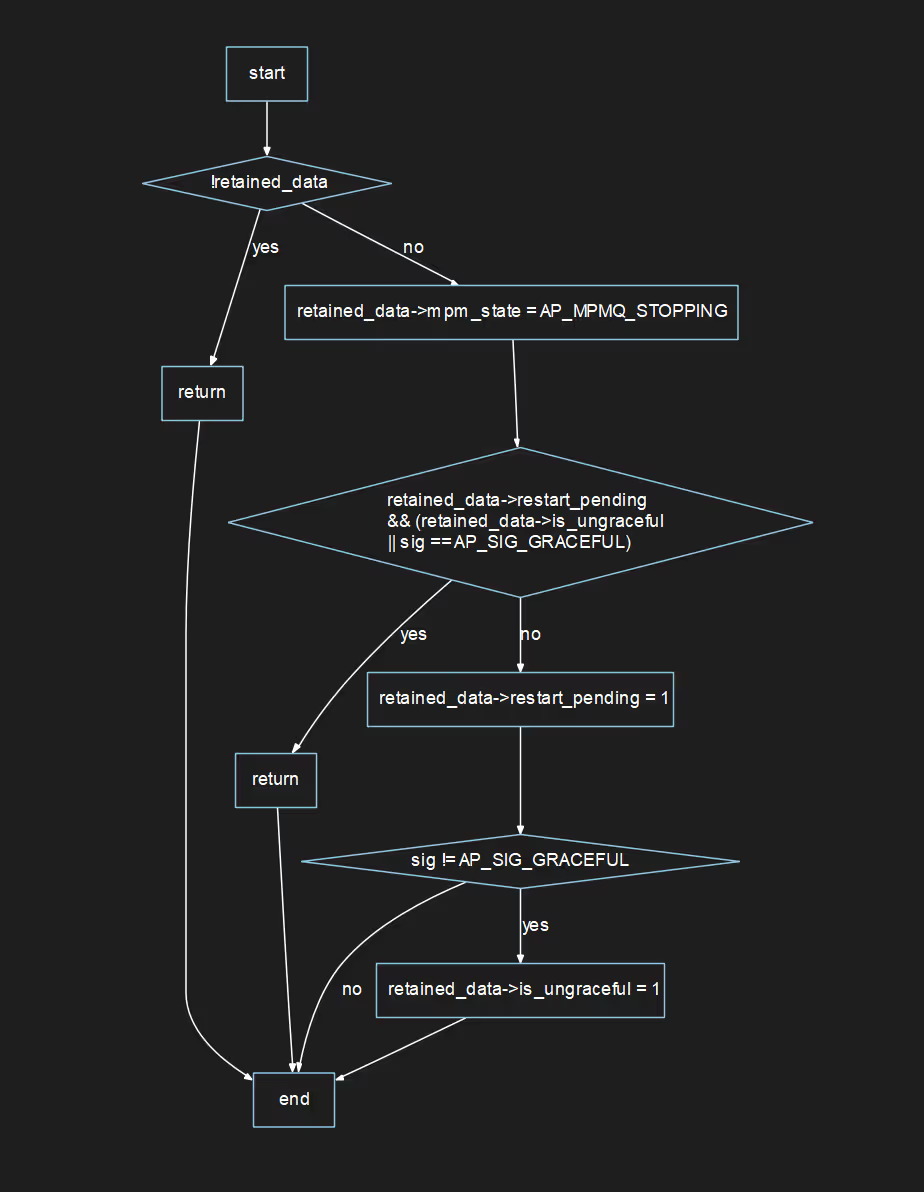
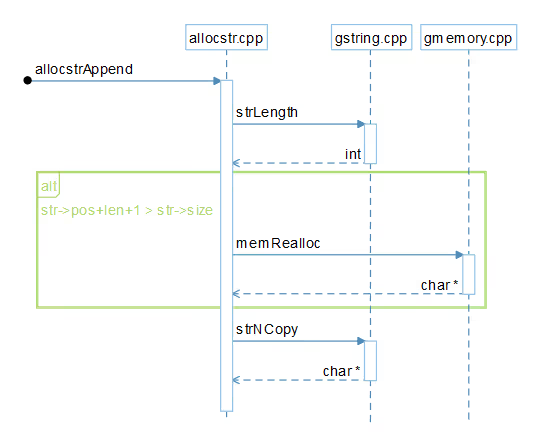
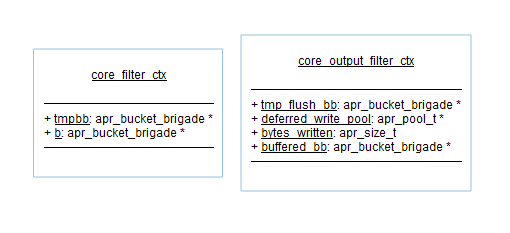
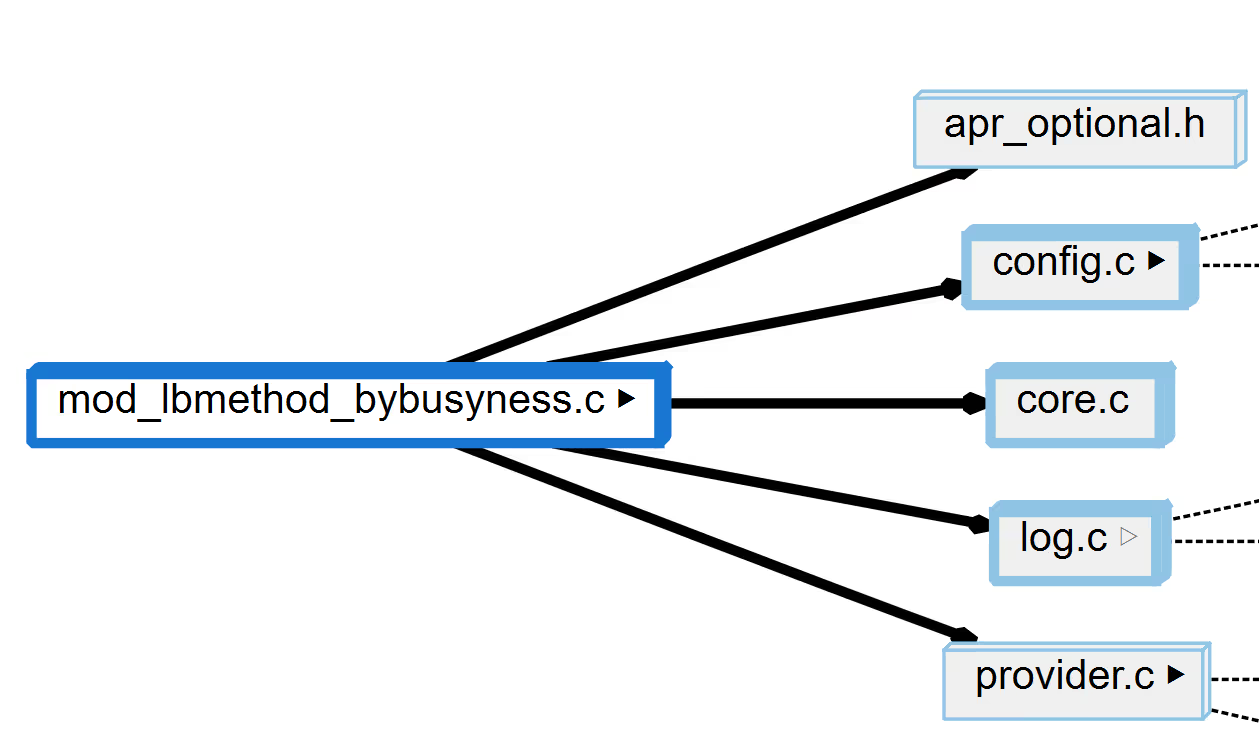
VIsualize your code with Control Flow, Call Trees, Dependency, Butterfly, UML Class, and more.

Receive detailed metrics about your code at the file, class, and entity levels.

Our API allows the creation of custom graphs, metrics, and lexical analysis. Integrating with your current tools is easy!

Cross reference technology makes you a safer, smarter engineer less likely to add bugs as you change code.

New members to your team can hit the ground running faster than ever with our code comprehension tools.

Understand confusing legacy code easily with our dependency analysis, cross references, and call trees.
Understand has been Spotlighted by the U.S. Navy's SBIR Transition Program
Understand helps hundreds of companies and government organizations, including the U.S. Navy, stay code compliant with our CodeCheck tool.
"NSWCDD needed a tool to ensure that their projects worked correctly and to ensure that the coding complied with the Navy Strategic Systems Program (SSP) coding standard. As an established tool that was reliable but also dynamic, flexible, and customizable, Understand piqued their interest."
-Navy SBIR Transition Program Spotlight
The Understand extension for VS Code makes our most used features even more accessible. Find the underlying types for variables, view control flow graphs, utilize thousands of code compliance checks, and perform a full analysis of your project in a fraction of the time compared to similiar extensions.
Go To DownloadHave you recently inherited confusing legacy code? Understand is here to help.
Blindly changing legacy code can lead to disaster. Know what your changes will affect before you even start writing.
Navigating legacy code doesn't need to feel like an endless maze. Quickly navigate references to create a mental map of the code base.
Expand a function's call tree to see what any changes might affect. You can also view Butterfly, Control Flow, and many other useful graphs.
Does your project require strict coding standards? Understand has the capability to check your code against industry, common, or custom standards.
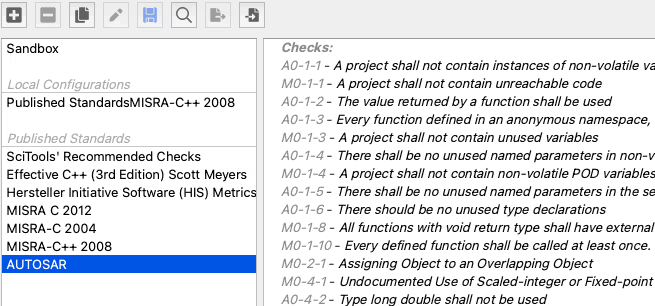
CodeCheck can be integrated into your CI/CD pipeline to run with every code check-in and notify team members when a compliance check has failed.
All rules come standard with every installation of Understand.
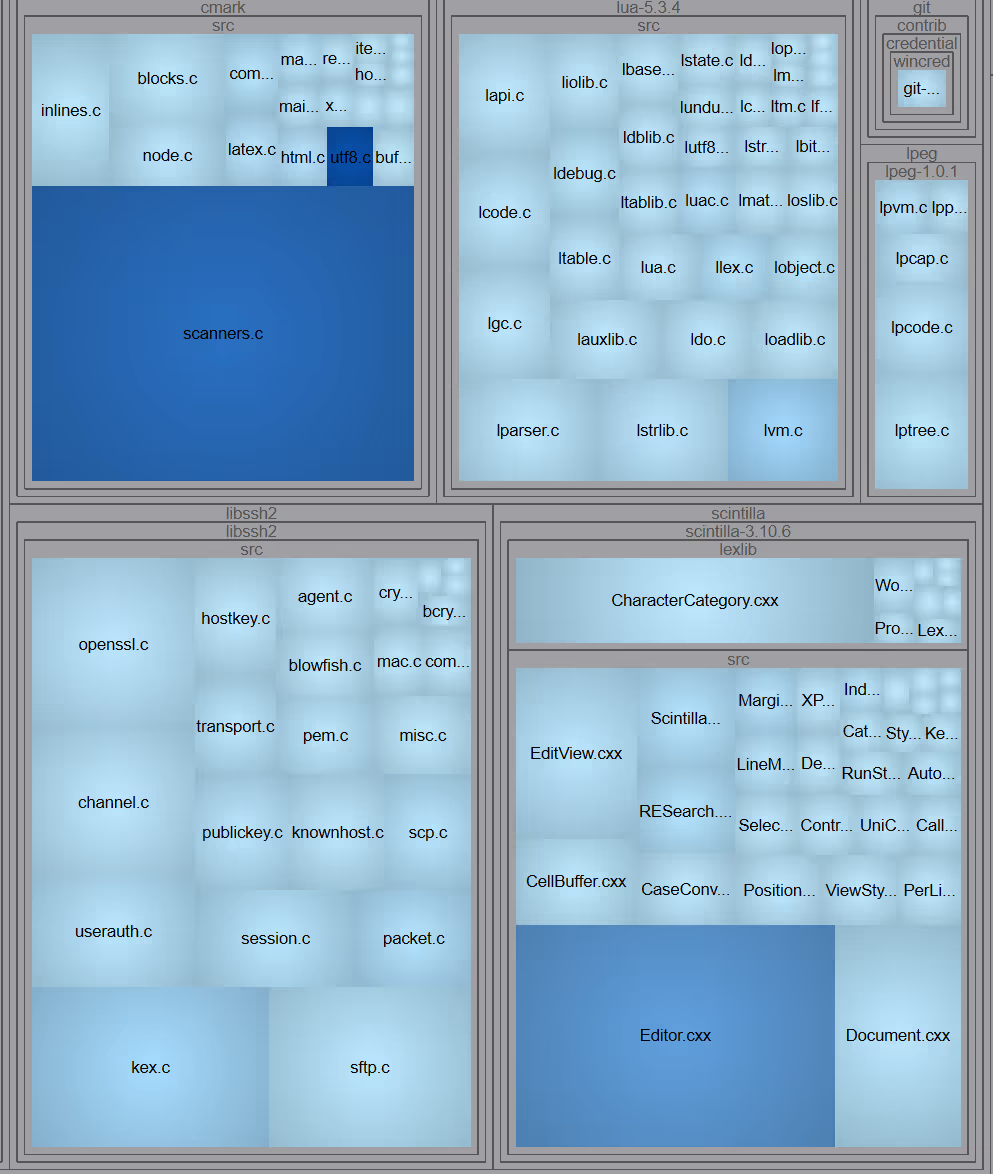
Quickly see the difference between two project states. View changes by files, folders, entities or architectures. View your changes as a text comparison or in a tree map. Just specify the git revision you would like to compare against or compare two databases.
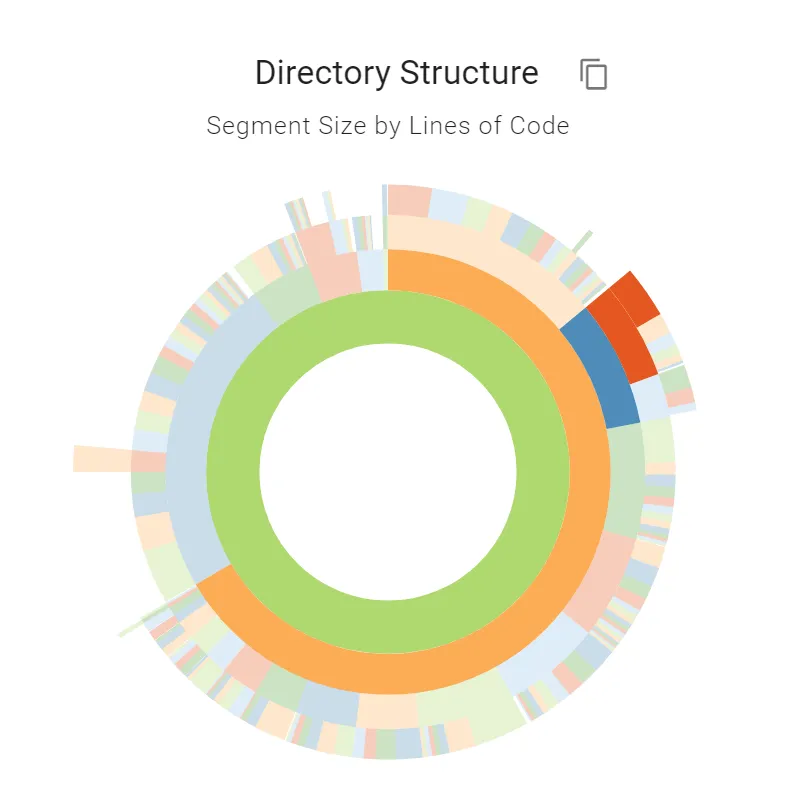
Quickly see how your source code is structured, organized, and related. See Control Flow, Call Trees, Dependency, Butterfly, UML Class, and many other graph types. All our graphs are interactive and customizable, expand or contract your graph to see exactly what you need.
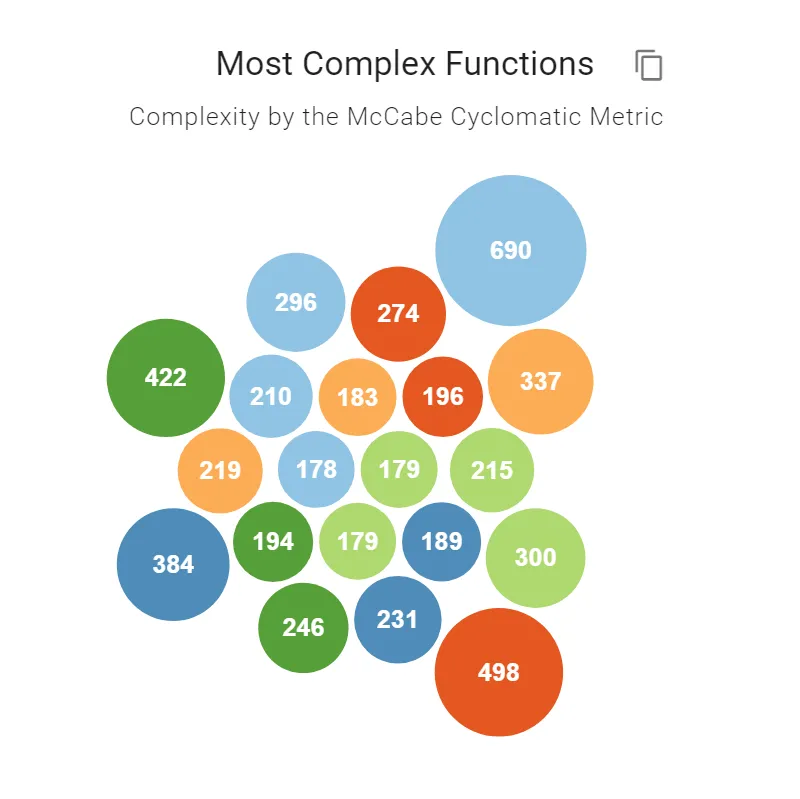
Do you need help locating the "problem" areas in your code? Understand comes bundled with dozens of metrics that help with exactly this scenario.
Do you prefer complete control over your coding environment? Understand comes bundled with a robust API to unlock your project's full potential.
Our API allows the creation of custom graphs, metrics, and lexical analysis. Integrating with your current tools is now easier than ever! Learn More
Verify code compliance, ensure code complexity stays below a specified threshold, or email the team a code comparison graph all from your existing pipeline. Learn More
Create and enforce any custom coding standard. We can teach you how to write a standard or simply hire us to handle the entire process for you! Learn More
1def fileCleanText(file):
2	returnString = "";
3
4	# Open the file lexer with macros expanded and
5	# inactive code removed
6	for lexeme in file.lexer(False,8,False,True):
7		if(lexeme.token() != "Comment"):
8			# Go through lexemes in the file and append
9			# the text of non-comments to returnText
10			returnString += lexeme.text();
11			return returnString;
12
13# Search for the first file named ‘test’ and print
14# the file name and the cleaned text
15file = db.lookup(".test.","file")[0];
16print (file.longname());
17print(fileCleanText(file));Navigating complex code relationships has never been easier. Hyper-Xref technology and the tools in Understand make you a safer, smarter engineer less likely to add bugs as you change code.
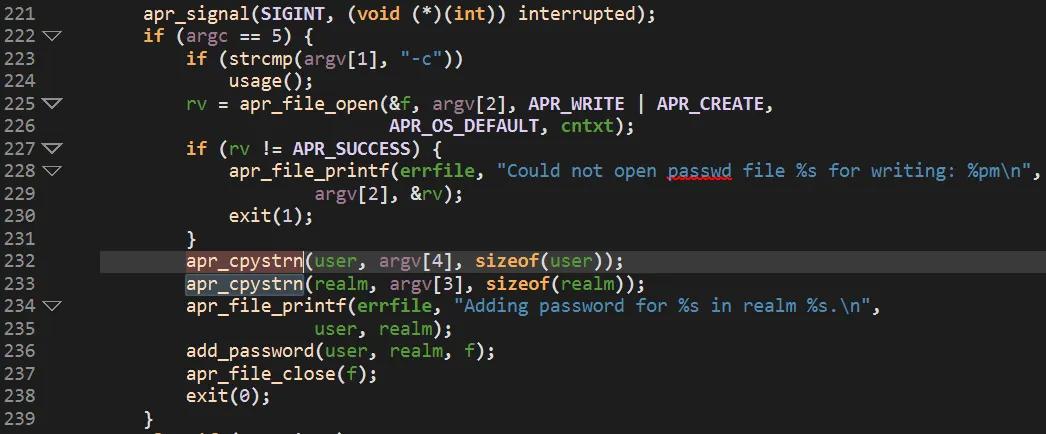
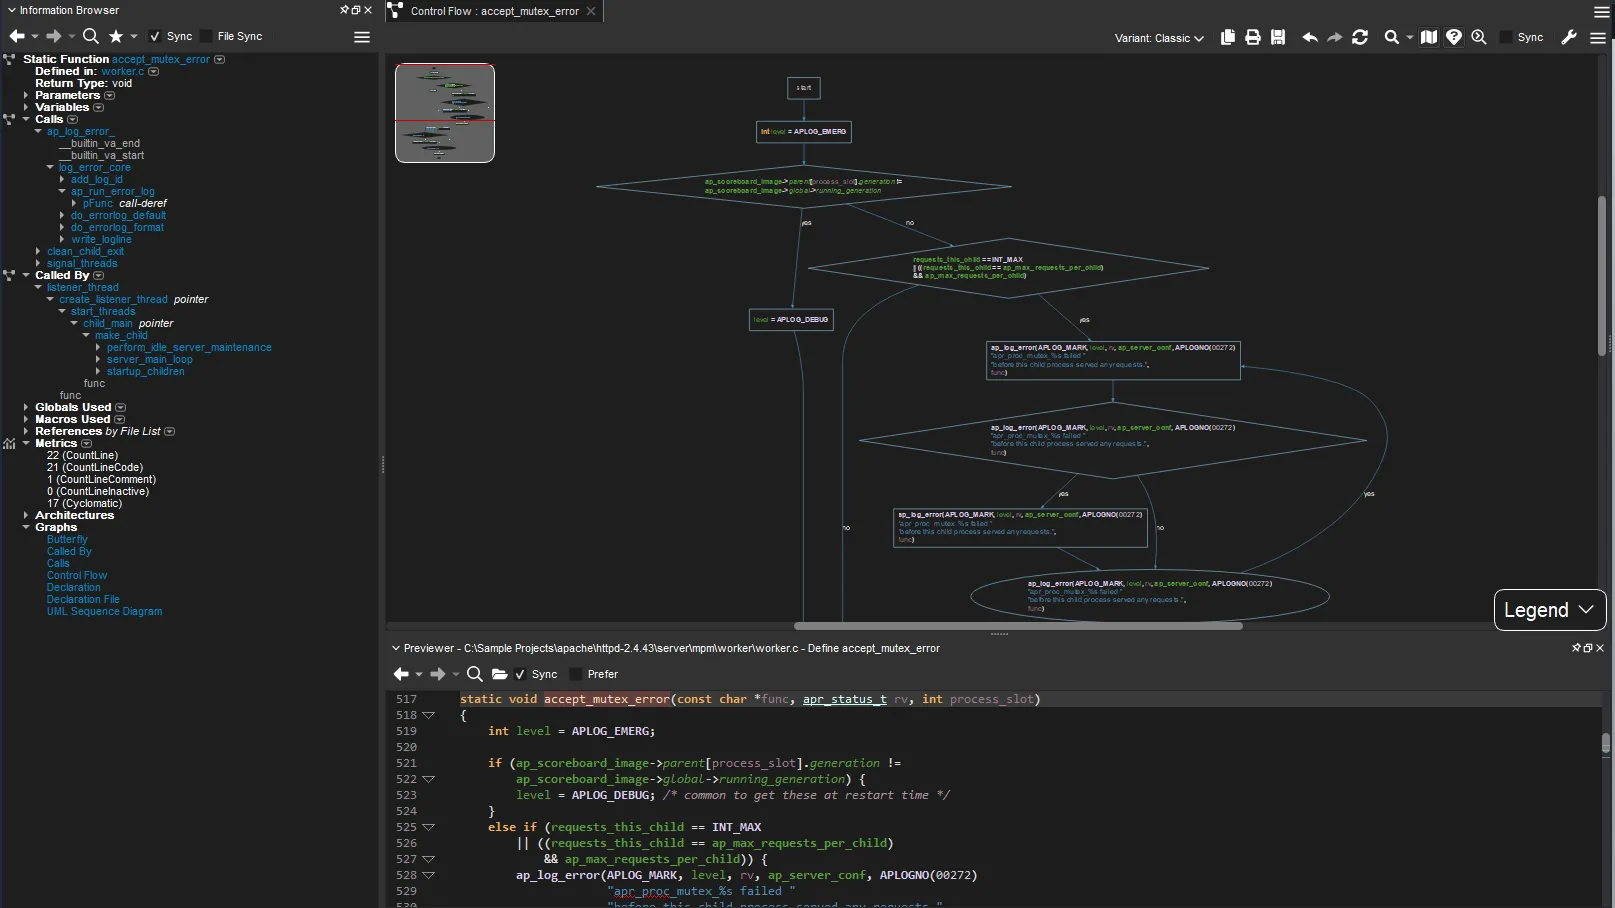
Understand contains a built in IDE that facilitates code browsing. Click on any entity (function, class, variable, etc) to see detailed information and double click to be taken directly to where the entity is defined. Every named part of your code is referenced and can be bi-directionaly navigated.
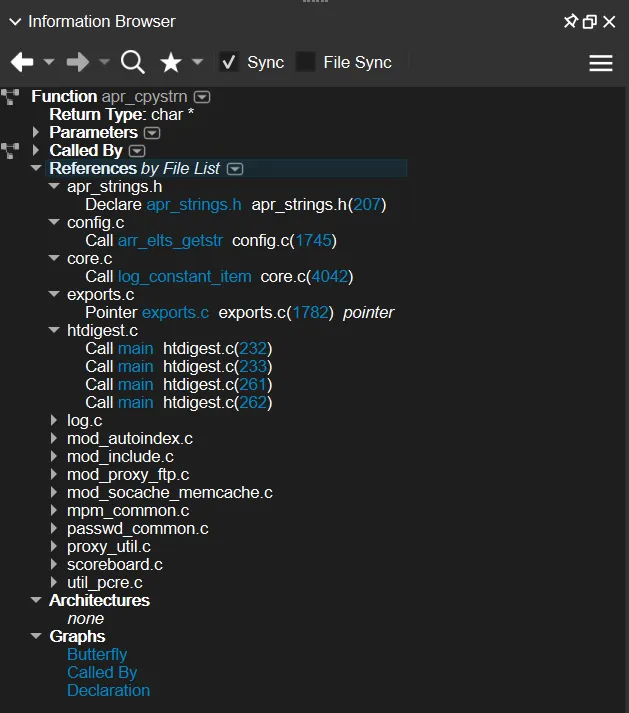
Keep the Information Browser pinned while you work to quickly see everything Understand knows about a selected entity. The Information Browser updates depending on what you have selected.
For functions, see the return type, paramters, and a list of references that take you to that instance immediately when clicked.
For files, see the member variables and functions, a list of includes, and relevant metrics.
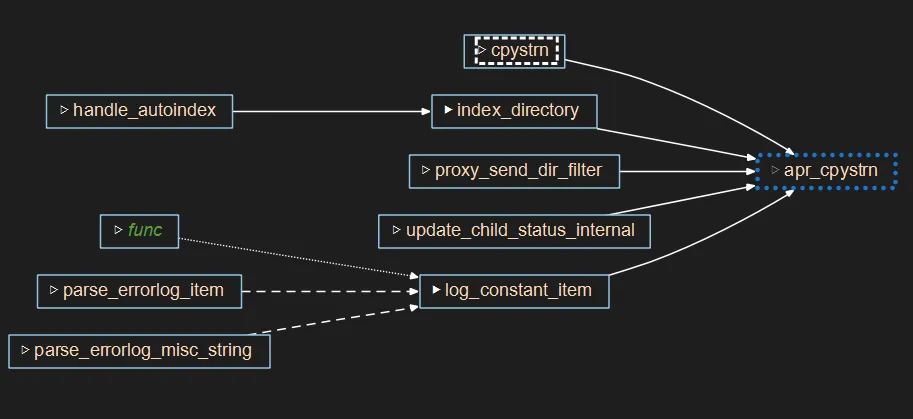
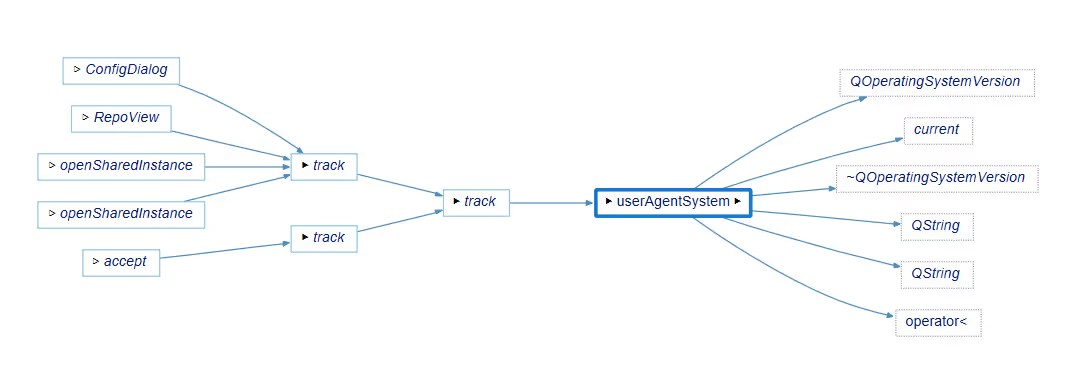
Graphs can also be accessed from the Information Browser or by right clicking any named entity in your code. Quickly see everything that calls or is called by a specific funtion with a Butterfly Graph.
Give your new engineers the tools they need to succeed. Understand helps onboard new engineers rapidly and safely.

“What would have previously taken me several days (or weeks) can now be accomplished in a matter of hours… It’s the Swiss army knife of static analysis tools.”

“[Understand] is good for discovering the structure of the code dependencies and call-paths... it would have taken me hours to generate the same thing on my own.”

Aerospace
“Understand accelerates my understanding of large source code repositories.”

“[Understand] has great graphing tools, metrics, reporting, data dictionary… and is customizable and extensible. It also helps you to find compile time and parsing errors.”
– USAF Software Developer
“AI, combined with the custom SciTools Python API, makes it possible to create plugins for the Understand environment that are an order of magnitude more powerful than previously would have been practical.”
– David Durlach, TechnoFrolics
“Understand can take existing code and basically generate any design information or view you would want to see, in addition to performing several useful types of analyses.”
– Jason Bold, Sr. Software Eng.
“Understand is a tremendous reverse engineering tool... with excellent metrics reporting and evolving standards verification capability.”
– Pratt & Whitney Software Developer
Understand plays a pivotal role in safeguarding the safety and success of NASA’s space missions. Understand enables them to navigate the complexities of diverse codebases, proactively mitigate risks, and ensure adherence to software quality standards.
“While other code checkers existed, each with its strengths and weaknesses, Understand’s additional features made it a valuable all-in-one tool.”
– Johannes Lang, R-Stahl
Understand by Scitools is certified for use as a support tool for all projects requiring ISO 26262, IEC 61508, and EN 50128 compliance. Safety is our top priority at Scitools, our software is heavily tested and vetted before each release providing your team with a safe and secure development environment.

We asked our users to send us pictures of their Understand setups, here are some of the submissions. Check out the full blog article
Chris Rhodes, Senior Software Engineer
Dell Inc.