Do you want to better understand your codebase? Using Understand's Graph feature is a great way to explore your project. Understand offers a variety of graphs including dependency, control flow, call graphs, and more.
Graphs are a visual representation of your code. Seeing your project visually helps you better understand relationships within your code, identify patterns and errors, and share your work with others.
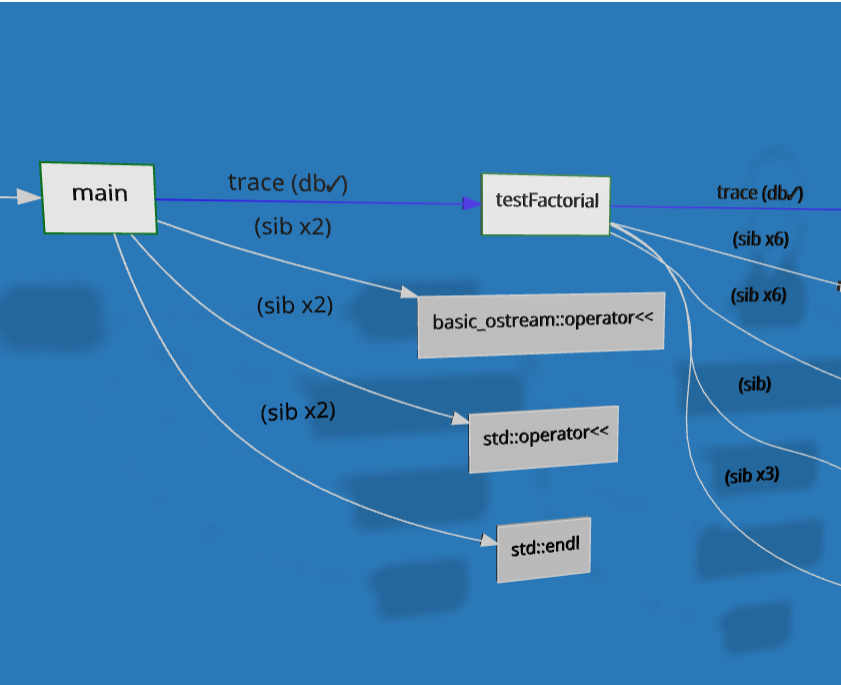
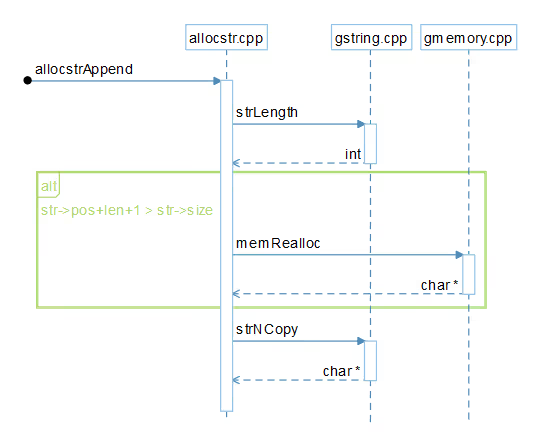
The most popular graphs in Understand include Call and Called by, Butterfly, Object References, Control Flow, UML Class Diagram, UML Sequence Diagram, Data Flow, Dependency, and Declaration. See more graphs on our blog!
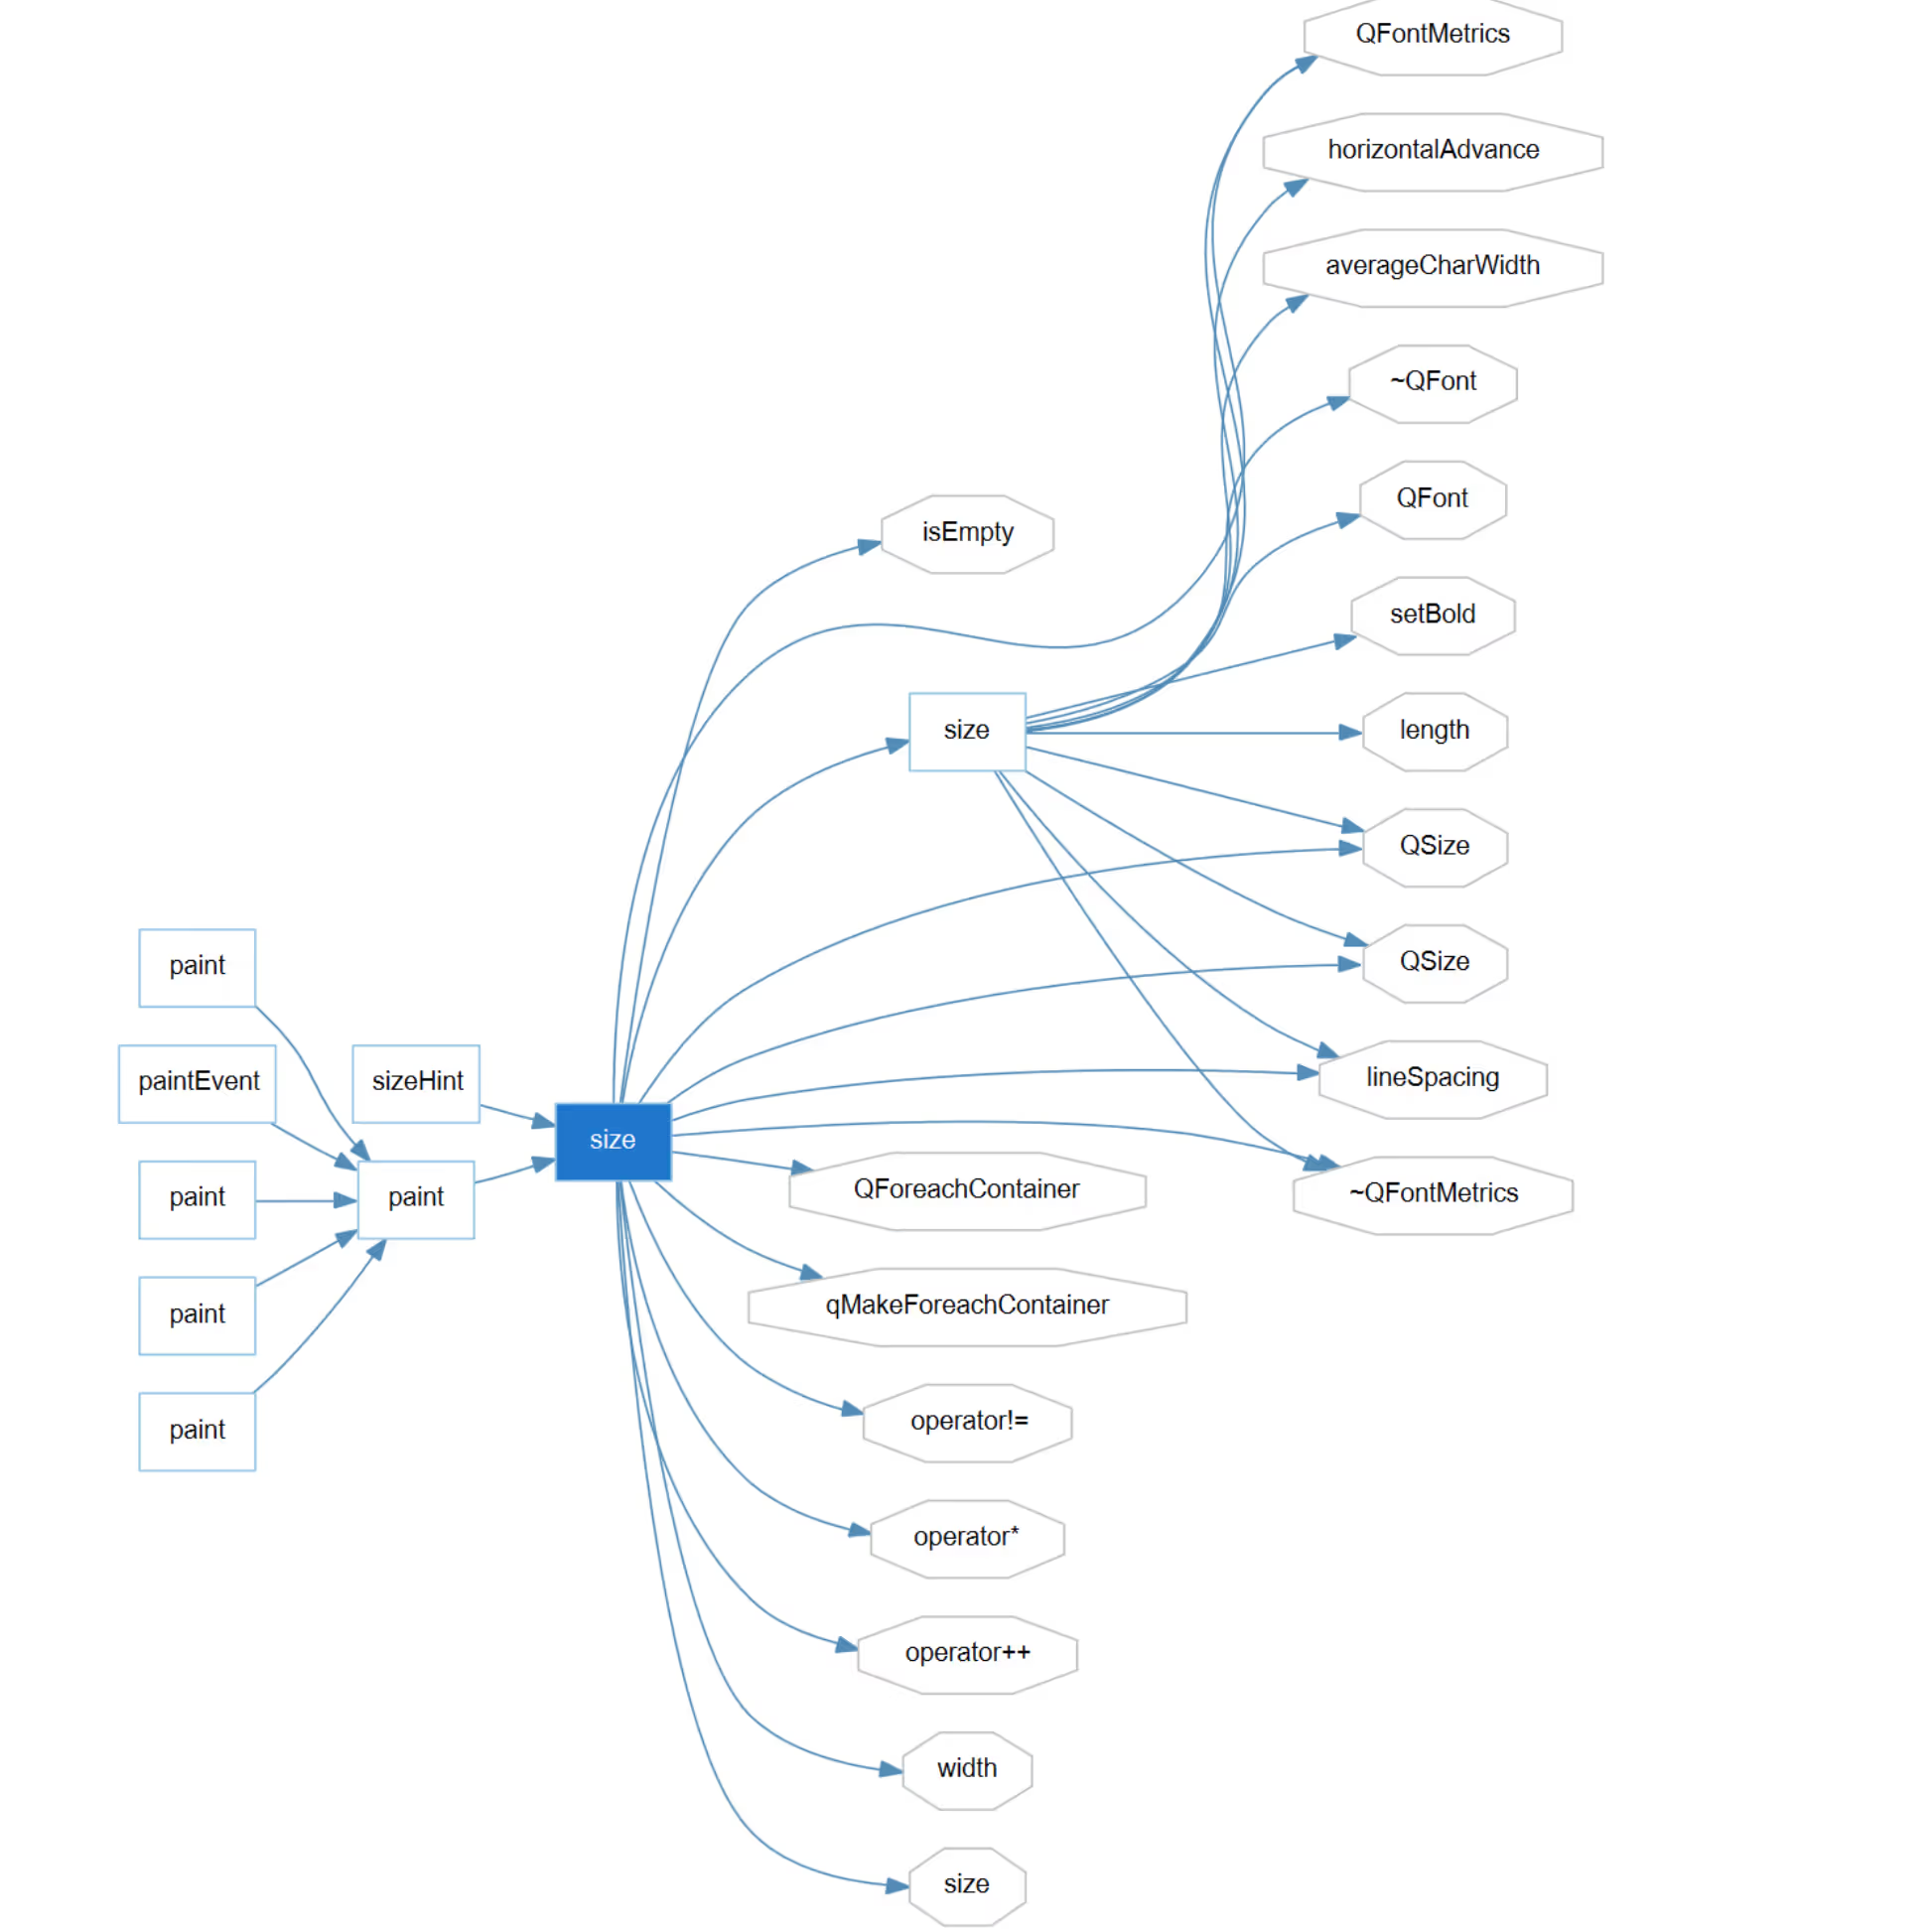
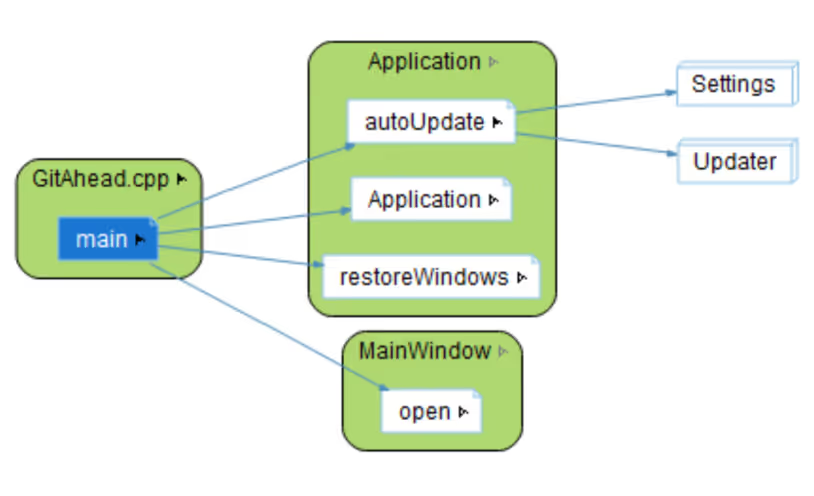
Graph variants allow you to quickly change the content and style of a graph. For example, to group functions by file or architecture, use a cluster graph variant (shown below). The relationship variant of a call graph will show all the paths between two functions. The compare variant highlights changes between your current project and a previous version of your project. Specific graphs have even more variants to explore.
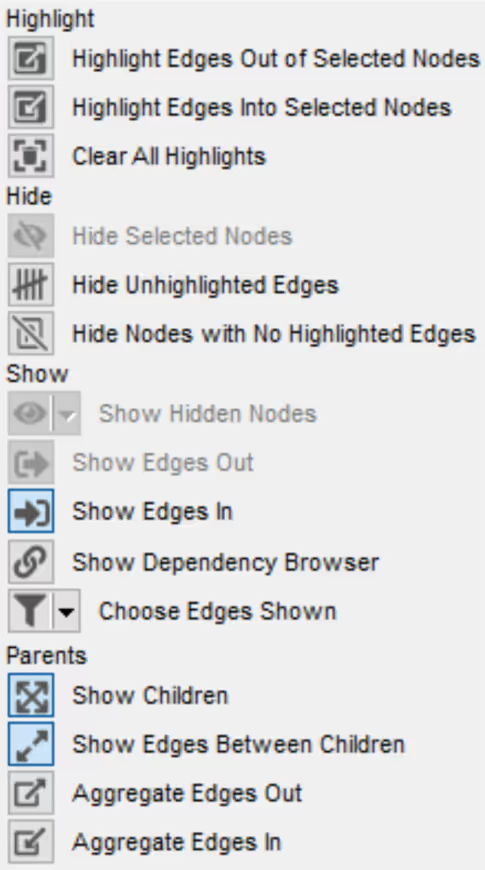
Choose from a variety of options in the submenu to interact with your code in helpful and interesting ways. For example, there are a variety of node options to select from in the customizer toolbar and/or legends.
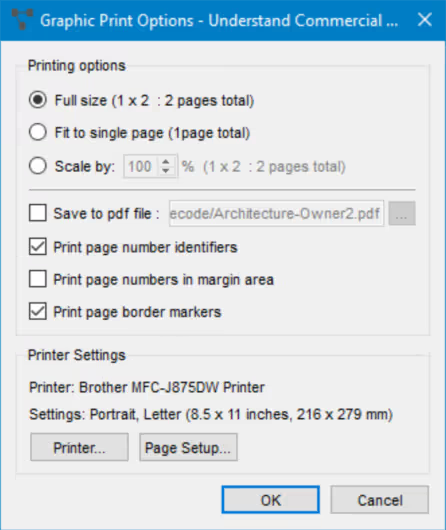
Graphs can be saved as JPEG, PNG, or SVG files. Share your graphs digitally, or print a physical copy of your work to share with others. We not only let you create cool graphs, but you can also edit and customize them with the Visio (vdx, vsdx) and Graphviz (dot) exports.
“What would have previously taken me several days (or weeks) can now be accomplished in a matter of hours… It’s the Swiss army knife of static analysis tools.”

“[Understand] is good for discovering the structure of the code dependencies and call-paths... it would have taken me hours to generate the same thing on my own.”

Aerospace
“Understand accelerates my understanding of large source code repositories.”


Chris Rhodes, Senior Software Engineer
Dell Inc.
“[Understand] has great graphing tools, metrics, reporting, data dictionary… and is customizable and extensible. It also helps you to find compile time and parsing errors.”
– USAF Software Developer
“AI, combined with the custom SciTools Python API, makes it possible to create plugins for the Understand environment that are an order of magnitude more powerful than previously would have been practical.”
– David Durlach, TechnoFrolics
“Understand can take existing code and basically generate any design information or view you would want to see, in addition to performing several useful types of analyses.”
– Jason Bold, Sr. Software Eng.
“Understand is a tremendous reverse engineering tool... with excellent metrics reporting and evolving standards verification capability.”
– Pratt & Whitney Software Developer
Understand plays a pivotal role in safeguarding the safety and success of NASA’s space missions. Understand enables them to navigate the complexities of diverse codebases, proactively mitigate risks, and ensure adherence to software quality standards.
“While other code checkers existed, each with its strengths and weaknesses, Understand’s additional features made it a valuable all-in-one tool.”
– Johannes Lang, R-Stahl