We don't just tell you where the bugs are, we show you how to understand and fix them.
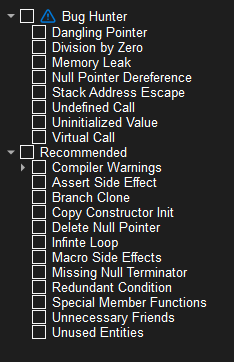
Dangling Pointer
Division by Zero
Memory Leak
Null Pointer Dereference
Stack Address Escape
Undefined Call
Unintialized Value
Virtual Call
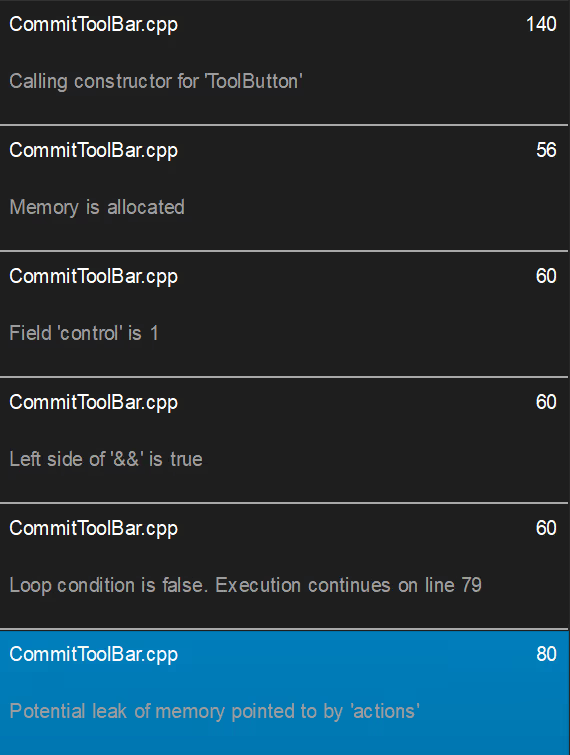
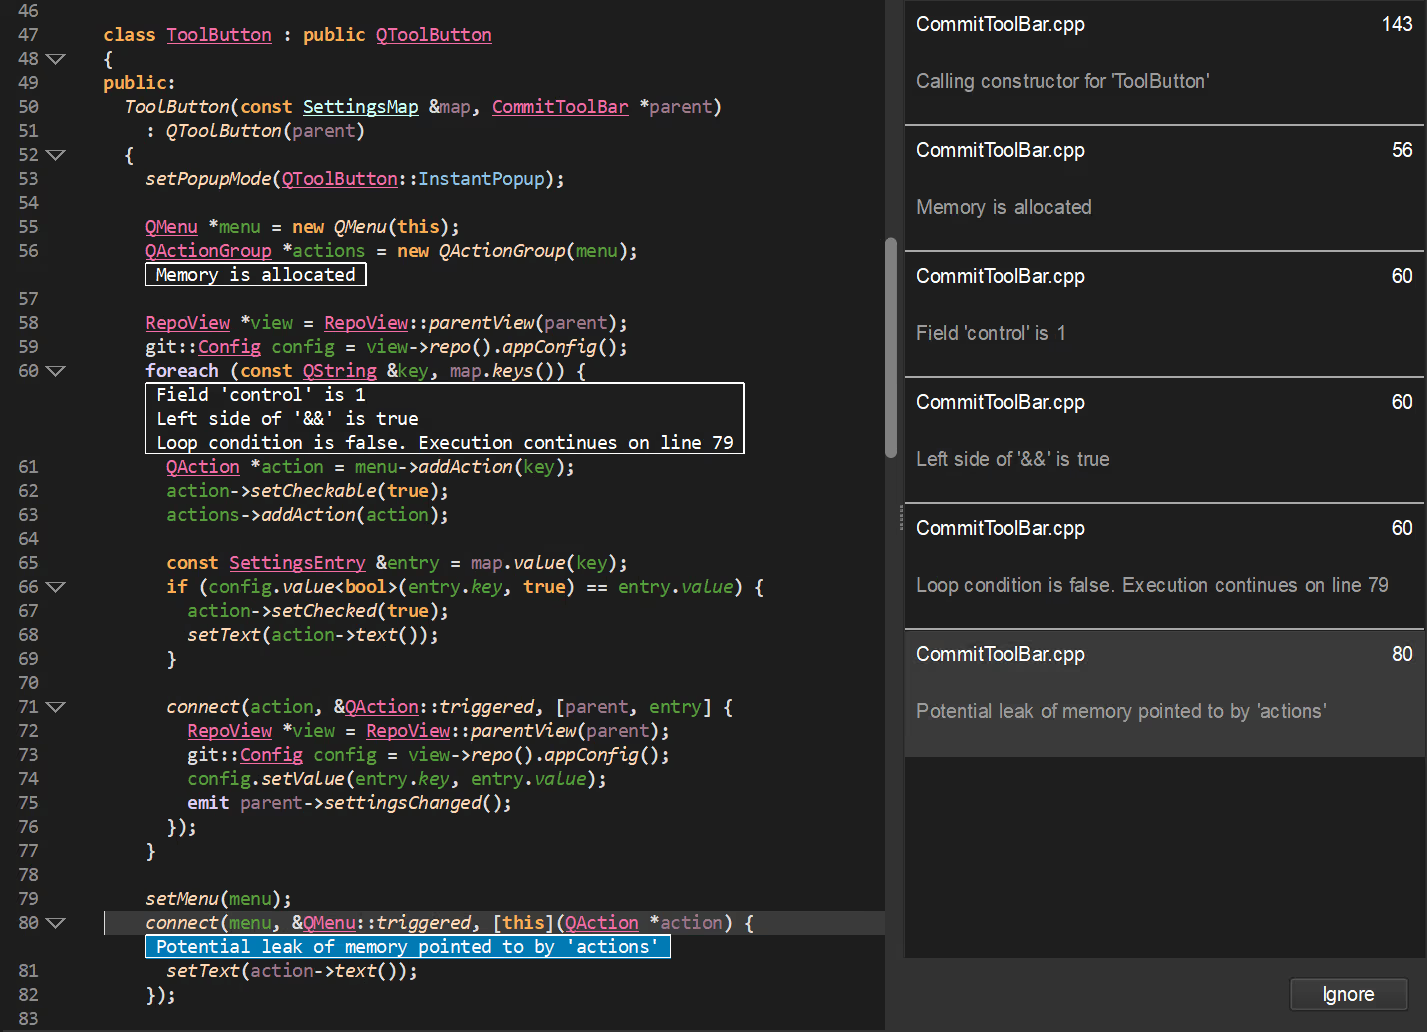
Bug Hunter will walk you through the code step by step, and explain how the bug was introduced
Add your source code to Understand and select which checks you would like to run in the background. Bug Hunter looks for bugs that are not easy to see with the naked eye. Our patented code parsing technology will search every function and dependency for potential issues saving your engineers valuable time.
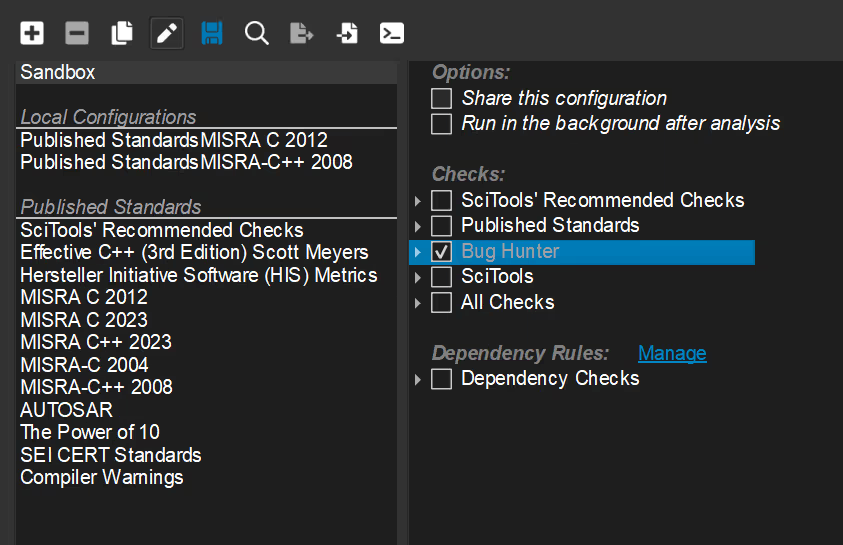
After choosing the bug checks to run on your project, Bug Hunter will get to work in the background. These checks can also be ran manually at anytime by accessing our CodeCheck feature. CodeCheck also comes bundled with over 3,000 code requirements to choose from. You can even add CodeCheck and Bug Hunter to your CI/CD pipeline to ensure your main branch stays clean with every commit.
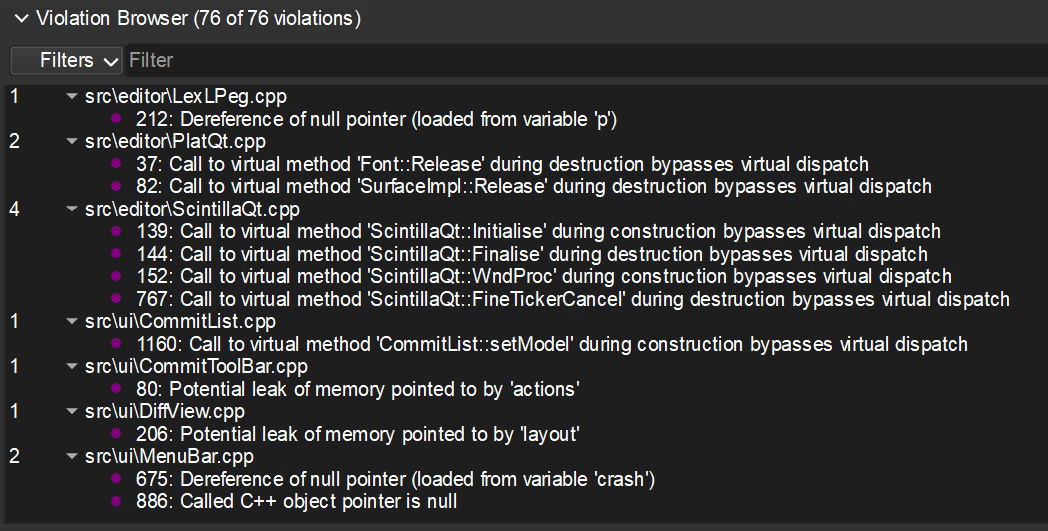
Issues detected by Bug Hunter will appear in the Violation Browser and in the sidebar when you browse your code. Issues are saved until the bug is fixed or the ignore option is selected, even between sessions. Issues can be searched and filtered, once selected you will instantly be taken to that location in your code.
After choosing a violation to explore you will see a list of steps on the right that explains the exact steps required to replicate the bug. Within the code editor you will see an explanation under each line of code that explains how the bug progresses. At this point you can either click ignore to dismiss the bug or modify the code and re-run Bug Hunter to ensure you've squashed that bug for good!
